
EPB Research
Investing, Real Estate, and Stock Market with a focus on leading indicators and business cycles.
Nutrition Label
EPB Research provides data-heavy macroeconomic analysis focused on predicting recessions and market cycles. While the best content offers deep dives into leading indicators like housing and labor metrics, some market updates can feel repetitive or less rigorous. Viewers get a consistent perspective on structural economic shifts grounded in historical data.
Strengths
- +
- +
- +
Notes
- !Look for videos focusing on specific historical metrics, as these offer significantly more depth than general market updates.
- !Verify the timeliness of the data presented, as macroeconomic indicators often have significant reporting lags.
Why this score
“The presenter displays a specific chart of 'Active Listing Count' to demonstrate inventory trends rather than just stating them verbally.”Open receipt
Trust Breakdown
Mixed / General Lens: Scored with the default trust weighting.
Confidence pending. Based on 10 long-form videos.
These six Trust Core outputs drive the public creator rating. Communication affects discovery ranking separately. Methodology →
Recent Videos
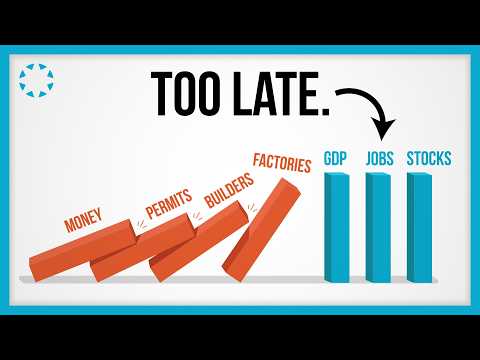
The 3 Most Famous Economic Numbers Are Always Late
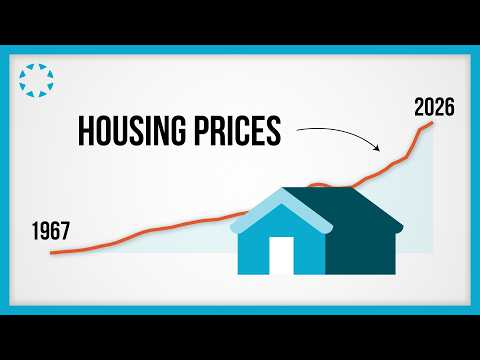
What Housing Prices Are Really Telling You | The Deeper Shift In The Economy
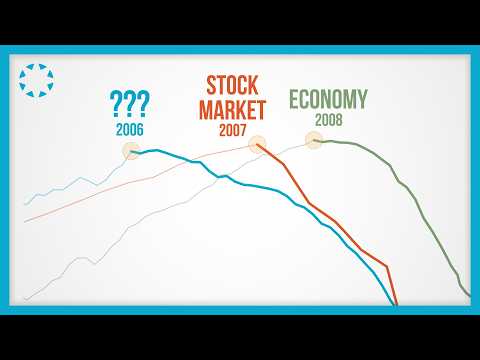
What Actually Leads the Stock Market
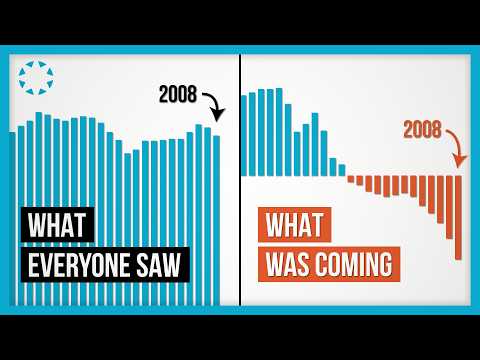
GDP Looked Fine in 2007. This Chart Didn't.
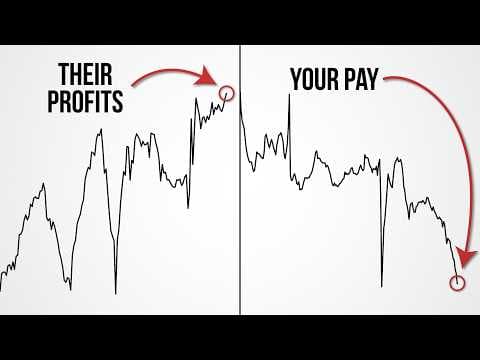
Corporate Profits Hit a Record High. Your Paycheck Didn't.
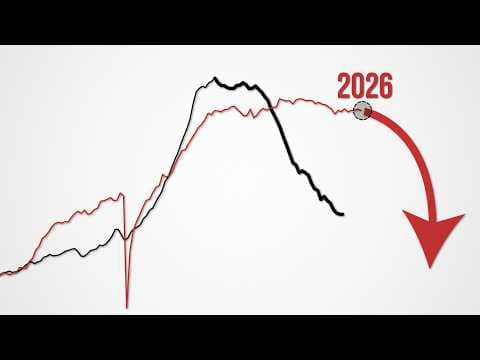
The Last Domino Is About To Fall
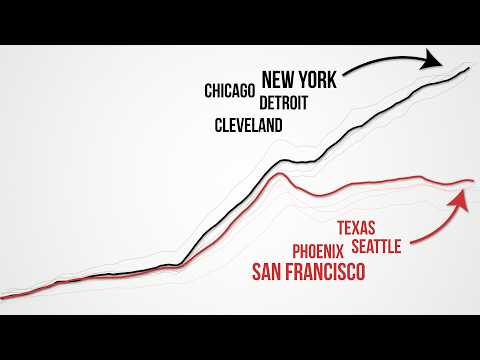
Half of US Housing Markets Are at All-Time Highs. Half Just Crashed.
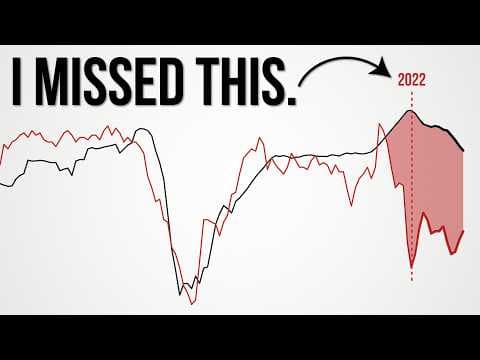
I Was Wrong About The 2022 Housing Crash. Here’s What I Missed.

Only 13% of Jobs Matter for Recessions

You're Watching the Wrong Housing Data

The Consumer Is 70% of GDP. Less Than 20% of It Matters.

What The Iran War Actually Means For The US Economy

The AI Boom Is Hiding A Sick Economy

Why Your Income Isn’t Growing

Why We’re Not in a Recession (Yet)
Shareable card
A compact ReReview card and short URL for sharing this trust score.